*PLEASE NOTE THAT ALL FIGURES AND PHOTOS ARE AT THE BOTTOM*
**PLEASE CLICK ON ALL IMAGES FOR A BETTER VIEW**
March 29, 2012 will be a historic day in history, weather wise, for the Rio Grande Valley. The day started partly to mostly sunny, and got terribly bad by late afternoon. This blog entry will try to explain to events that led up to the severe weather, and why it did so much damage.
Dynamical Viewpoint
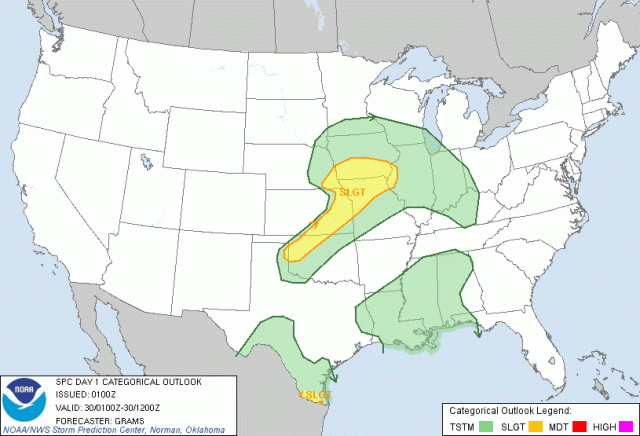
This event was very difficult to forecast. The National Weather Service (NWS) called for a 20%-30% chance of showers and thunderstorms the night of the hail storm. The Storm Prediction Center (SPC) had the RGV under a “General Thunderstorm” (green filling) forecast (figure 1), until their 0100UTC, 8 PM CDT, update (figure 2). This is where they included most of the Valley under their “Slight Risk” (yellow filling) forecast until 1AM CDT . A “Slight Risk” means there is a slight risk of severe thunderstorms, capable of producing damaging winds, damaging hail, and possibly tornadoes. They increased their probabilities of severe winds by 10%, severe hail by 10%, and a tornado by 2% on their 0100UTC update. There were no severe watches issued out by SPC, either. Now, this is not to criticize the Storm Prediction Center, this is emphasize how difficult this storm was to forecast.
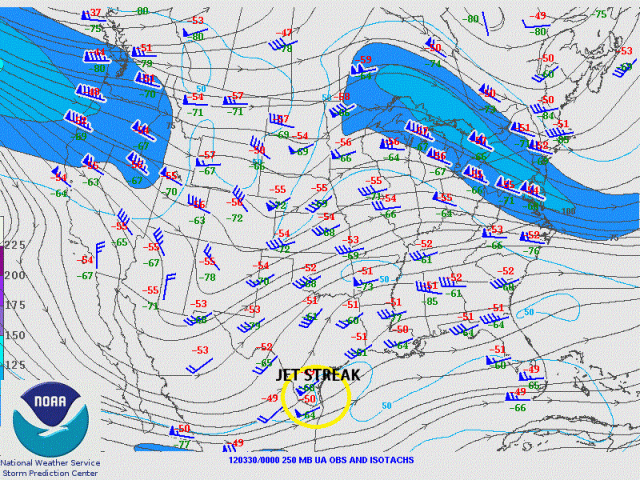
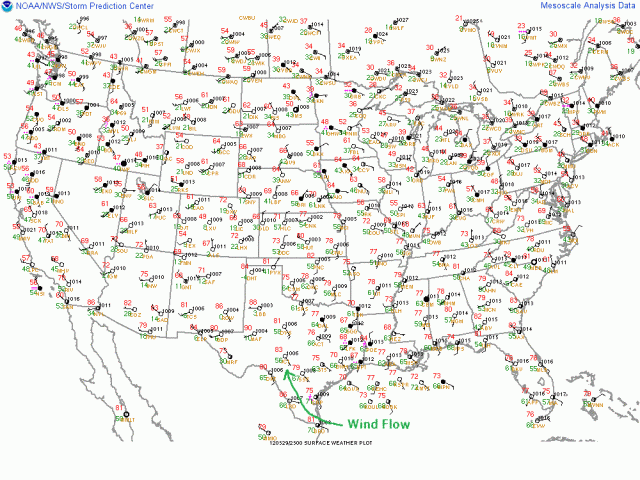
The atmosphere over the Rio Grande Valley was already unstable due to 250mb jet streak (figure 3), divergence at 300mb (figure 4), a negatively tilted shortwave trough around 500mb (figure 5), ample Gulf moisture blowing in from the E/SE at the surface(figure 6), 2855 J/kg MUCAPE at 12Z (KBRO sounding), 3055 J/kg MUCAPE at 00Z March 30, and an eroding cap by afternoon (figure 7). Therefore, if any storm got going, it had the potential to go severe. This is exactly what happened in Kenedy County.
At around 4PM, on March 29, 2012, light easterly winds sparked what is called a sea breeze. Showers, and eventually thunderstorms formed in Kenedy County (figure 8). These storms were slow moving, due to light steering winds, between 925 mb and 850 mb. By 4:30PM, the NWS in Brownsville issued out a severe thunderstorm warning for these two cells because of high winds and small hail. At the same time these storms formed, severe storms were moving easterly out of Mexico, drawing closer to the RGV (figure 8). At 5:40PM, NWS Brownsville still had a severe thunderstorm warning for most of Kenedy County, but the southern cell was looking more like a classic supercell (tornadic cell, figure 9). Around 6:00PM, the first tornado warning was issued for extreme south-central Kenedy County (figure 10). This storm was moving very slowly towards the south and eventually prompted a tornado warning for extreme north-central Willacy County (figure 11).
The storms in Mexico were producing outflow boundaries, or gusts of wind being pushed out from the energy of the thunderstorms. New thunderstorms started forming along these boundaries. The convergence of the outflow boundaries from the storms in Mexico, the sea breeze, and the outflow boundaries from the storms over Kenedy and Willacy Counties, contributed in thunderstorm development in northern Hidalgo and Starr County around 7:00PM. Because the outflow boundaries were steering these thunderstorms, and were traveling in opposite directions, the thunderstorms were very slow moving. And because they were slow moving, they quickly exploded in the unstable environment and went severe. Some of the storms had Vertical Integrated Liquid (VIL) values greater than 75 kg/m^2. VIL is measured by NEXRAD (Doppler radars), which outputs how much liquid is in a certain column of air. It is also a good indicator of hail. Generally, the higher the VIL value, the STRONGER the storm and BIGGER the hail.
It is very rare to see VIL values above 50 kg/m^2 in the Valley, but not impossible. The NWS considers severe hail to be anything larger than penny sized. With VIL values greater than 50, it is possible to have hail the size of quarters or larger.
Around 9:00PM VIL values reach around 100 kg/m^2 with the storm that traveled south between Faysville and McCook, and then west of Edinburg (figure 12). Golf ball sized hail was reported on the west side of Edinburg as the storm moved through. The storm ended up producing tennis and baseball sized hail in the McAllen/Mission area. You can see a hook, or a hook echo to the storm in figure 12, indicative of a tornadic storm. 2 minutes after I took this snap shot of the storm, the NWS issued out a tornado warning for Mission, McAllen, southwest Edinburg, and Pharr. Figure 13 shows the tornado warning (purple box) and velocities of the storm; green colors mean winds blowing towards the Doppler radar, located in Brownsville, and red colors mean winds blowing away from radar. The National Weather Service reissued the tornado warning by 9:45PM for McAllen, Pharr, Hidalgo, Alamo, San Juan, and southern Donna. By 10:30PM, the cell was still severe, but no longer tornadic, as it moved east along Expressway 83.
Summary
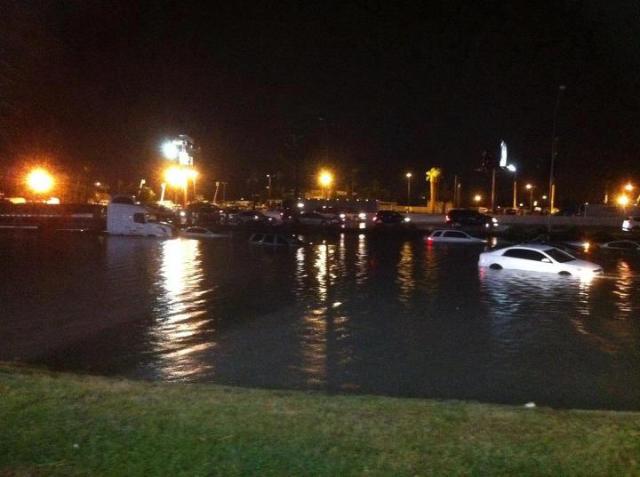
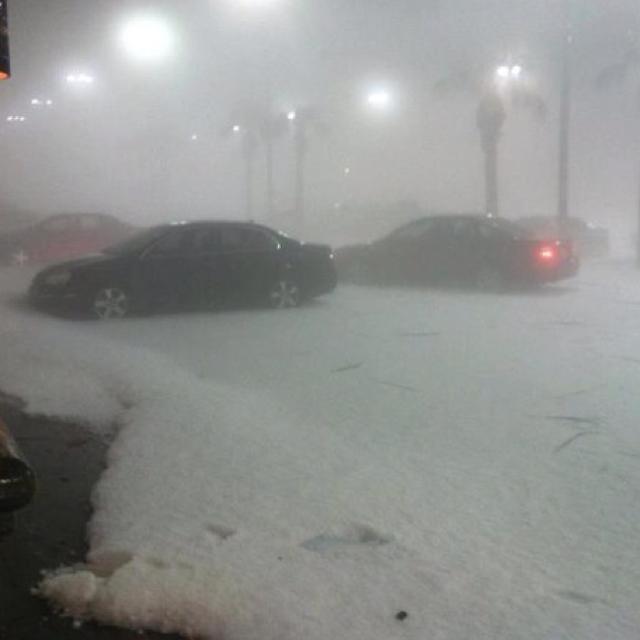
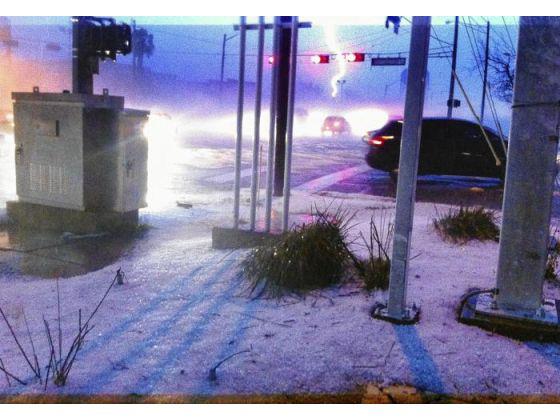
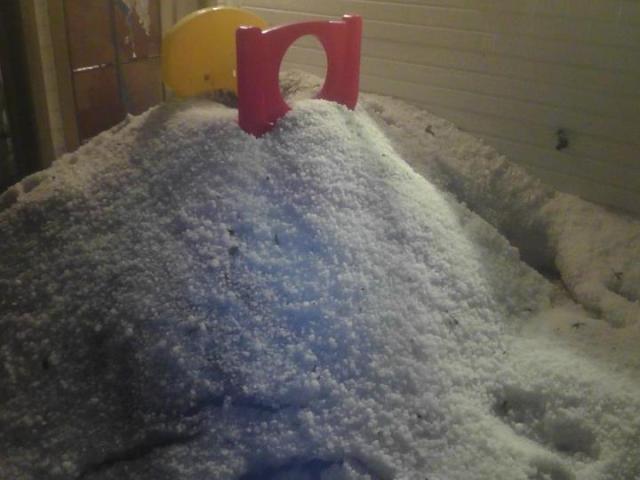
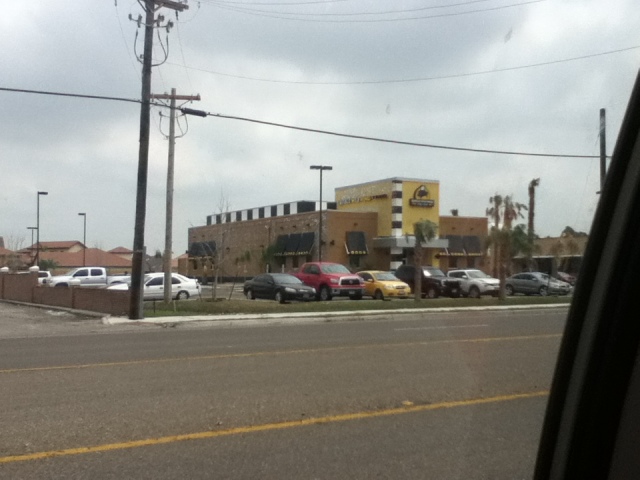
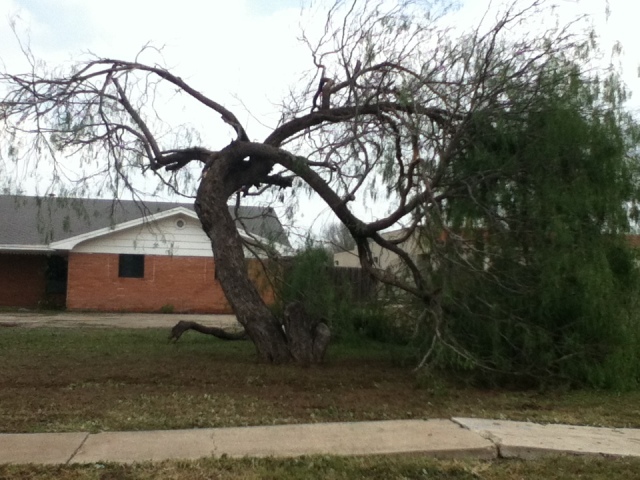
This storm was very historic, especially for the Rio Grande Valley. Non-stop, large, hail and wind gusts more that 65mph, over a period of 30 minutes left many homes, businesses, and vehicles heavily damaged. A wind gust of 74mph (minimal hurricane force) was recorded at the McAllen/Miller International Airport. The airport also recorded 3.99 inches of rain in a 1 hour period. Because this storm impacted a city and an area of over 100,000 people, damage from wind, hail, and flooding was devastating. Luckily, there were no deaths or major injuries as of this writing. Damage was so bad that McAllen’s assistant city manager was quoted in saying: “The debris and flooding left after night’s storm are worse than when Hurricane Dolly hit in 2008.” The NWS in Brownsville conducted a survey of the damage and concluded that there was NO evidence of a tornado hitting the Mission/McAllen/Pharr area. All damage was done by straight line winds, NOT A TORNADO. To read their preliminary storm report please click here. There are some photos that I took after the storm and some that people around McAllen took during the storm at the very bottom. If you see a photo that is yours and want it taken down or is not credited properly, let me know.

Figure 1. Day 1 outlook from SPC on March 29, 2012. RGV is under a "general thunderstorm" (non-severe) forecast.
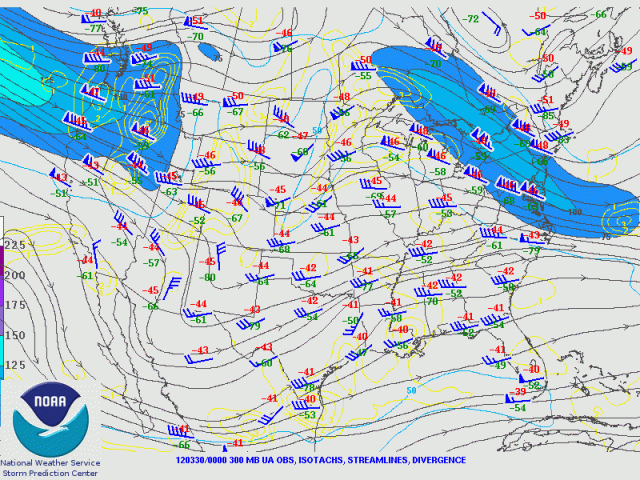
Figure 4. 00Z 3/30/2012 300 mb analysis. Yellow lines indicated divergence at this level in the atmosphere. Divergence at this level usually indicates lift at or near the surface or.. clouds/precipitation.

Figure 5. 00Z 3/30/2012 500 mb analysis. Brown dashed lines indicate the trough axis of the mid-level short-wave trough. Yellow arrow indicates wind flow at this level.

Figure 8. KBRO doppler radar around 4:20pm CDT 3/29/2012. Red box is a Severe Thunderstorm Warning. Storms in Mexico are also visible.
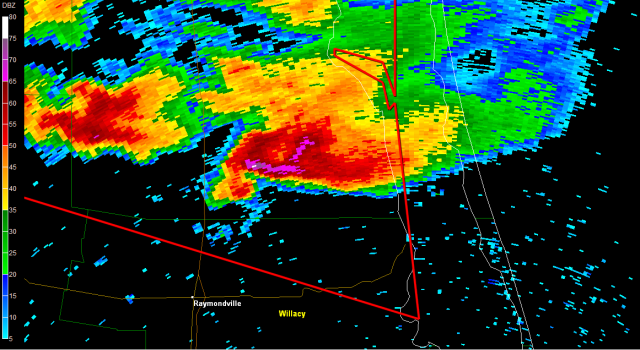
Figure 9. KBRO doppler radar around 5:30PM CDT. This storm cell is taking the shape of a classic supercell structure (tornadic cell). Notice the hook, or wedge on the southwest part of the storm.
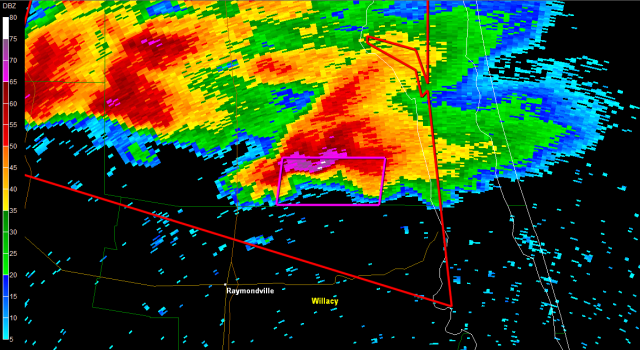
Figure 10. KBRO doppler radar around 5:55PM CDT. NWS Brownsville issues out first tornado warning (purple box) of the day for south-central Kenedy County.
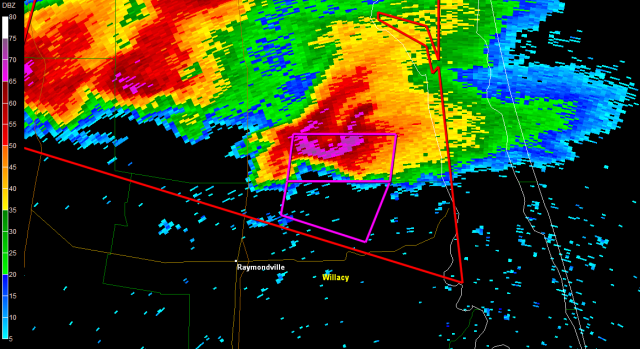
Figure 11. KBRO doppler radar around 6:10PM CDT. NWS Brownsville issues out a tornado warning(purple box) for north-central Willacy County.
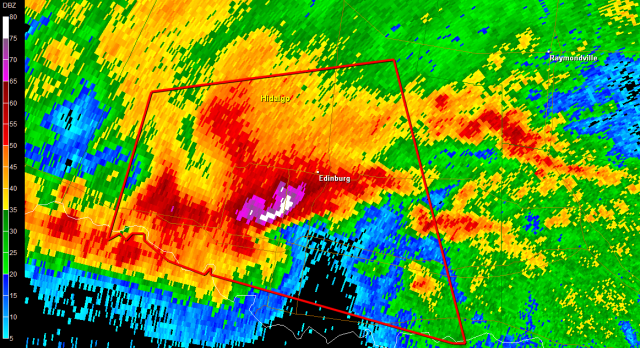
Figure 12. KBRO doppler radar around 9:08PM CDT. This cell southwest of Edinburg takes the shape of a tornadic supercell, with a visible hook. Red box is a severe thunderstorm warning. NWS issued out a tornado warning about 1-2 minutes later.
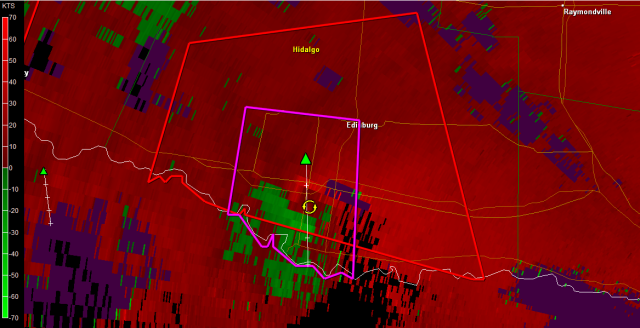
Figure 13. KBRO doppler radar velocities around 9:26PM CDT. Purple box is a tornado warning. Circulation is visible between Pharr and McAllen. However, there was no tornado confirmation.
Images

Image 7. Courtesy of Angel Garcia, submitted to KRGV Channel 5 News. Hail sizes that fell in McAllen.
Aftermath








This really brought a lot of money to the community and put a facelift in the storms path.